How I Got Computer-Use Clicks to under 10 ms on Modal
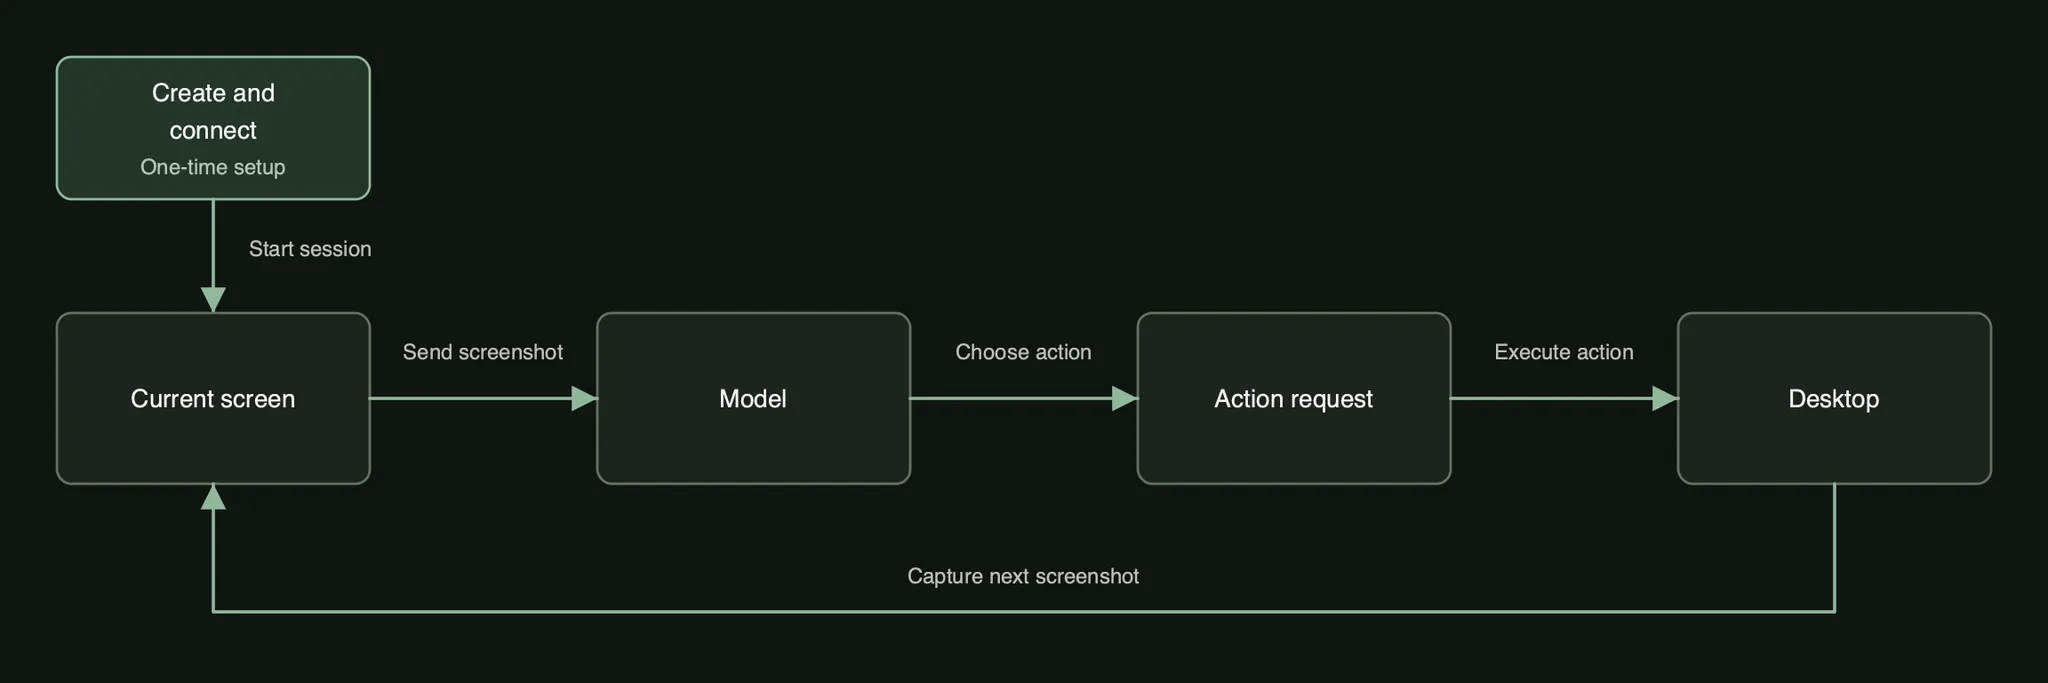
A model that uses a computer needs a computer to use. Not yours, so you rent one from your favorite local sandbox company. A Linux desktop runs in a sandbox and your computer-use agent (CUA) takes the wheel. It asks for a screenshot, looks at the screen, sends back some action like a click or to type.
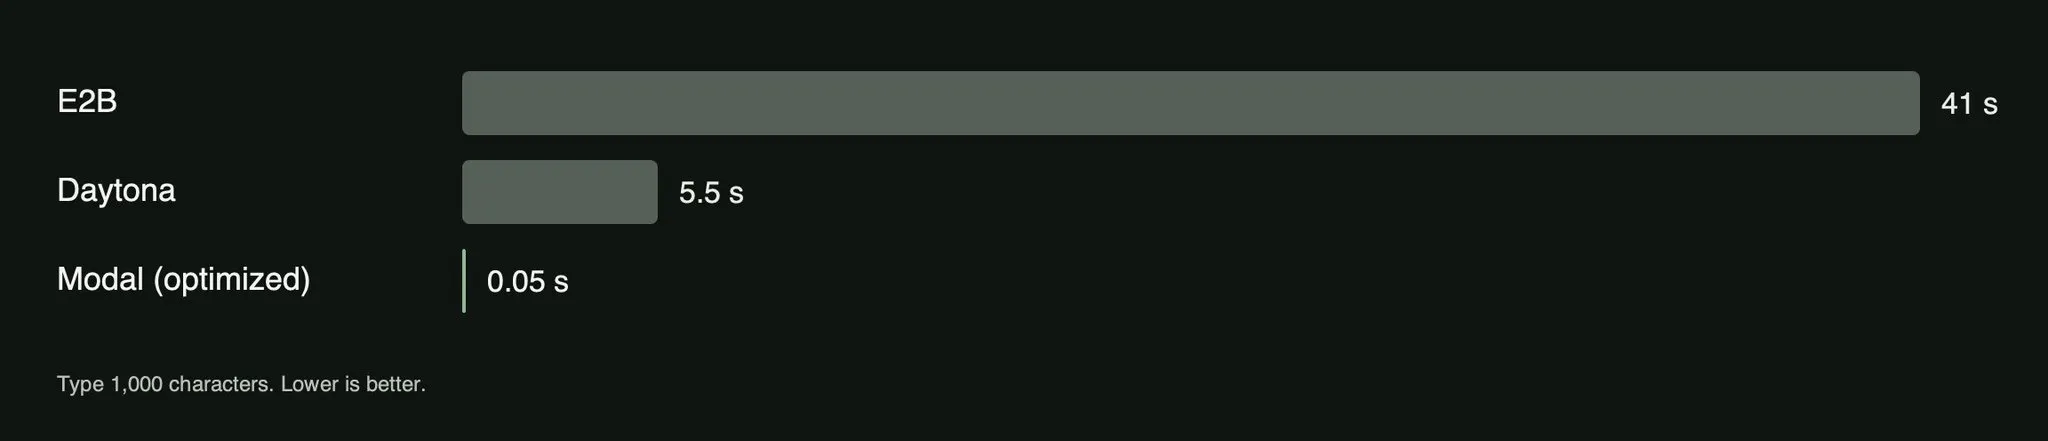
E2B & Daytona provide their own computer-use SDKs, so I wanted to see how efficient they were. To type 1,000 characters, roughly 10 sentences, with no agent latency included, it took 41 seconds on E2B. And on Daytona, it took 5.5 seconds. A huge waste that adds up as computer-use is increasingly used in realistic longer-horizon tasks.
So I built the fastest computer-use framework using Modal primitives. For the same 1000 character typing task, my optimized Modal setup took 0.05 seconds.
Then I tried to map out the most common task: The screenshot and action loop primitive is what a CUA repeats, once a turn, until the task is complete. So, how long does a screenshot and a single click take? Daytona took 950 ms, then E2B took about 410 ms. Before I optimized anything, my simple Modal setup took about 330 ms, already faster than both. After optimizing, the same task took only 47 ms, ~7x faster than the simple Modal setup.
Let’s see this in action: Over fifty total agent turns, counting no agent reasoning and generation time at all, Daytona’s 950ms is 48 whole seconds spent on nothing but processing screenshots and clicks. E2B’s 410ms is 21 seconds. And with the optimized Modal setup, 47ms turns to only ~2 seconds.
OpenAI says GPT-5.6 Sol on Cerebras can generate up to 750 tokens per second. At that speed, hundreds of milliseconds in the computer interface stop hiding behind slow generation. Longer trajectories make it worse, because the delay is paid on every turn before the user sees anything. Infra will be the next bottleneck in frontier computer-use agents.
I first thought of all the ways we use remote desktops today. For IT support, remote desktop control has to feel almost seamless. So, I searched for the most lightweight remote desktop control framework. Then I found RustDesk, an open-source remote desktop system. I knew this was it, even the name RustDesk sounded fast. Looking inside, I saw that it connected to the remote machine once, when the session starts, and reuses that connection for everything after. For example, moving your mouse sends an event over a connection that is actively ready.
My first Modal setup did the opposite. Every action launched, used that launch once, and would throw it away. It provided a quick way to push actions and not have to worry about complexity. But in the need for speed, I identified the various odd ways this waste happens, over and over again in different parts of the system, and saved that time using Modal primitives and engineering. To build the fastest computer-use SDK and open-source it.
Round trips
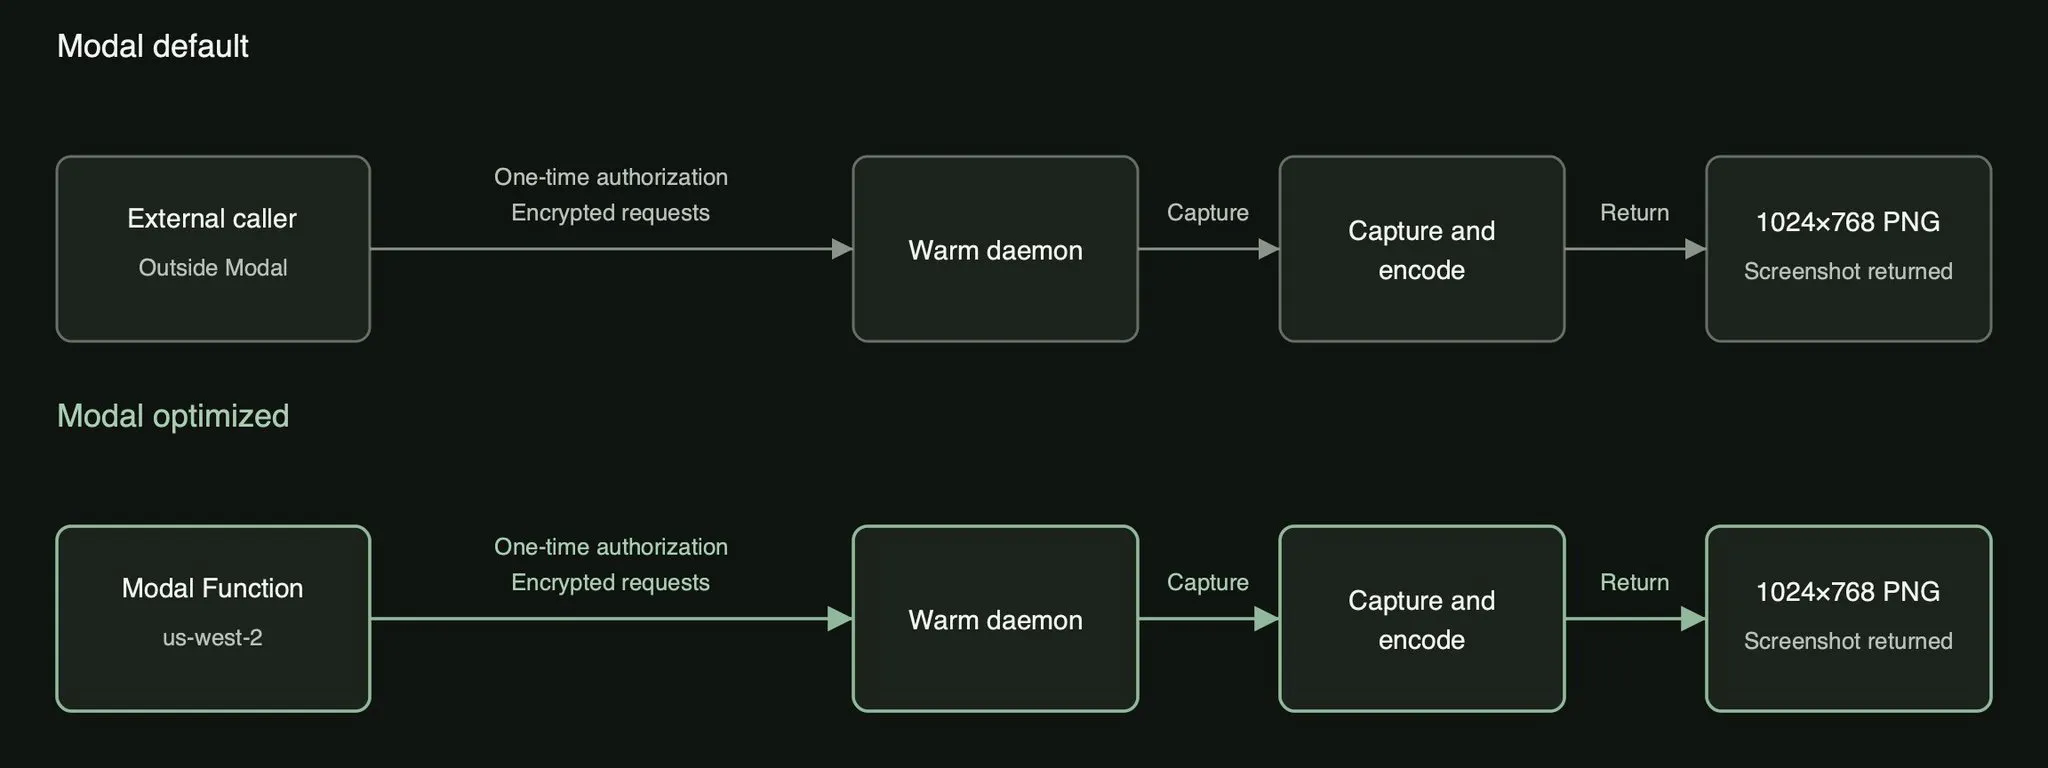
Each screenshot request left my laptop, crossed into Modal, reached the daemon inside the desktop Sandbox, and carried the PNG back over the same authenticated route. A full 1024x768 screenshot took 116 ms. This was on the simple Modal setup. Then the model picked a click, and the action request made the same full round trip again.
The desktop is a Linux machine in a Sandbox, and the daemon inside it owns the screen and the mouse. The client is the code that asks for a screenshot and sends back a click, and it can run anywhere that can reach the daemon.
The desktop already ran in a Modal Sandbox. What if the client ran on Modal too?
So to test this, I ran the same client code used to drive requests into the desktop in two places. First from my laptop. Then from a Modal Function, a primitive that gives an autoscaled container for application code. I requested us-west-2 for the Function and for the Sandbox, which keeps both physically close together. From each, I measured the simple “move-and-click” task: The client sends an x and y coordinate and which mouse button to press, and the reply is the coordinate the pointer landed on. Barely anything travels in either direction, so nearly all of what it costs is the trip itself.
From my laptop the move-and-click task took 39.3 ms. From the Modal Function it took only 4.7 ms.
Looking one layer deeper, the daemon itself processing the click did about a millisecond of work in both cases. Precisely, the trip to the desktop and back took 38 ms from my laptop and 3.4 ms from the Function.
Then I ran the same comparison on a different task, a full screenshot. The client asks for a frame and a 1024x768 PNG comes back. It took 86.8 ms from my laptop and 38.1 ms from the Function. Looking into the function, why was it still 38.1 ms?
To look deeper I isolated the capture/encode/transport cycle. Breaking down the remaining 38.1 ms from the Function, the desktop spent 23 ms capturing and encoding the frame, and so it spent that 23 ms whether the client ran on my laptop or in the Function.
Zooming back out to the transport cycle, even colocated, a click carrying almost nothing still spent 3.4 ms on the trip from a Modal Function to the Modal Sandbox. Requesting us-west-2 does not put the two machines as close as they could be. The Function and the Sandbox can still land in different buildings, and every request still goes through authenticated ingress. I use a Modal attested tunnel for this ingress. The authentication token is exchanged once at startup, but the routing happens on every request.
You may ask why don’t I delete this round trip entirely by running the client inside the Sandbox, but then my code would live in the machine I am isolating. Here are the two main issues with placing the client in the Sandbox: (1) Our Sandbox is an untrusted machine, (2) The client is tied to the Sandbox. To contrast, because we use autoscaling Modal Functions to host the client then we can use a single client to control many Sandboxes.
Why did every screenshot start a new process?
With the route shortened, I went looking inside the screenshot handler. Every frame launched a command-line capture program, wrote a temporary PNG to disk, reopened the file, and returned its bytes of an image. A computer-use agent needs a screenshot for almost every single request, so the fifty-turn loop from the opening spawns fifty of those processes and writes fifty temporary files. The screenshot handler of the past was certainly built without that fact in mind.
Every window on the desktop draws through X11, the display server that owns the pixels, and X11 was running the whole time. What restarted on every frame was everything on my side of it: a new process, a new connection to the display, a new buffer, a file on disk.
So I kept the capture client open instead. The daemon opens MSS, a small Python screen-capture library, on the first screenshot that can use it and holds that session open for as long as the daemon runs. On Linux MSS uses XShm, which lets the X server hand back a frame through shared memory rather than pushing it down the display socket. A screenshot became a read out of a buffer that already existed, encoded to PNG in memory.
However, two cases still take the old path. MSS cannot compose the X11 cursor visually, so a cursor-visible screenshot uses file capture. If the display connection breaks, the daemon reopens it once and falls back to file capture if that fails too.
Deleting a per-action xdotool process took a move plus one click from about 146 ms to 1.2 ms inside the daemon. Screenshots were paying that same kind of setup, and a temporary file on top of it.
A process for every click
On my laptop a click feels like one event, it’s just a single click after all. The actual system underneath sees three: pointer motion, button press, button release, each delivered to whichever application owns that spot on the screen. macOS routes them through Quartz; my Sandbox runs a Linux desktop under X11. Either way, an agent’s click(x, y) has to become those separate events before an application can respond to it.
My first implementation handed that translation to xdotool, the standard command-line tool for X11 automation. It already knew how to talk to the display and synthesize input, and one line of shell per action was hard to argue with. Every API action launched a new xdotool process.
A pointer move plus one click took about 146 ms inside the daemon. Before replacing it I went to look at what xdotool does beneath the CLI, expecting to find a slow protocol. It uses XTest, the X11 extension for synthetic input, through Xlib. So, the events were actually not the expensive part.
A click at (x, y) needs three XTest calls: move the pointer, press the button, release it. xdotool wraps those three calls in an entire program lifetime. Before X11 saw the pointer move, Linux had to create a child process, load the xdotool binary and its shared libraries, parse the coordinates and the button, and open a connection to the display. After the release, the process closed the connection and exited.
That trade is the right one for what xdotool was built for. Someone writes one line of shell to dismiss a dialog that keeps stealing focus, binds it to a key, and never thinks about it again. The script never has to manage a display connection, and a broken xdotool cannot take its caller down with it. The 146 ms lands between a keypress and a glance at the screen, where nobody has ever noticed it.
An agent has no glance. The model produces a click, the client sends it, and the next one arrives as soon as the model produces that. The setup is on the critical path every time, and a fifty-turn task pays it fifty times.
Interestingly, the fix was the same one as the screenshot handler but applied at a lower level. I kept XTest and stopped launching a program to reach it every time. The optimized daemon loads the X11 client libraries once and holds a single display connection open for its lifetime, so everything xdotool did per action now happens at startup instead. A click became three XTest calls from code that is already running, with nothing forked and no connection opened or closed. Each request takes the input lock, pushes the motion, press, and release, and synchronizes with the X server once at the end.
That last sync replaces something the old path did for free. A process cannot exit without closing its display connection, and closing it sends whatever Xlib still has buffered, so waiting for xdotool to exit was also waiting for the events to land. Nothing closes a connection held open for the daemon’s lifetime, so without an explicit flush the daemon could report a click that never reached the screen. One call at the end of the sequence buys back the guarantee, and the connection stays open.
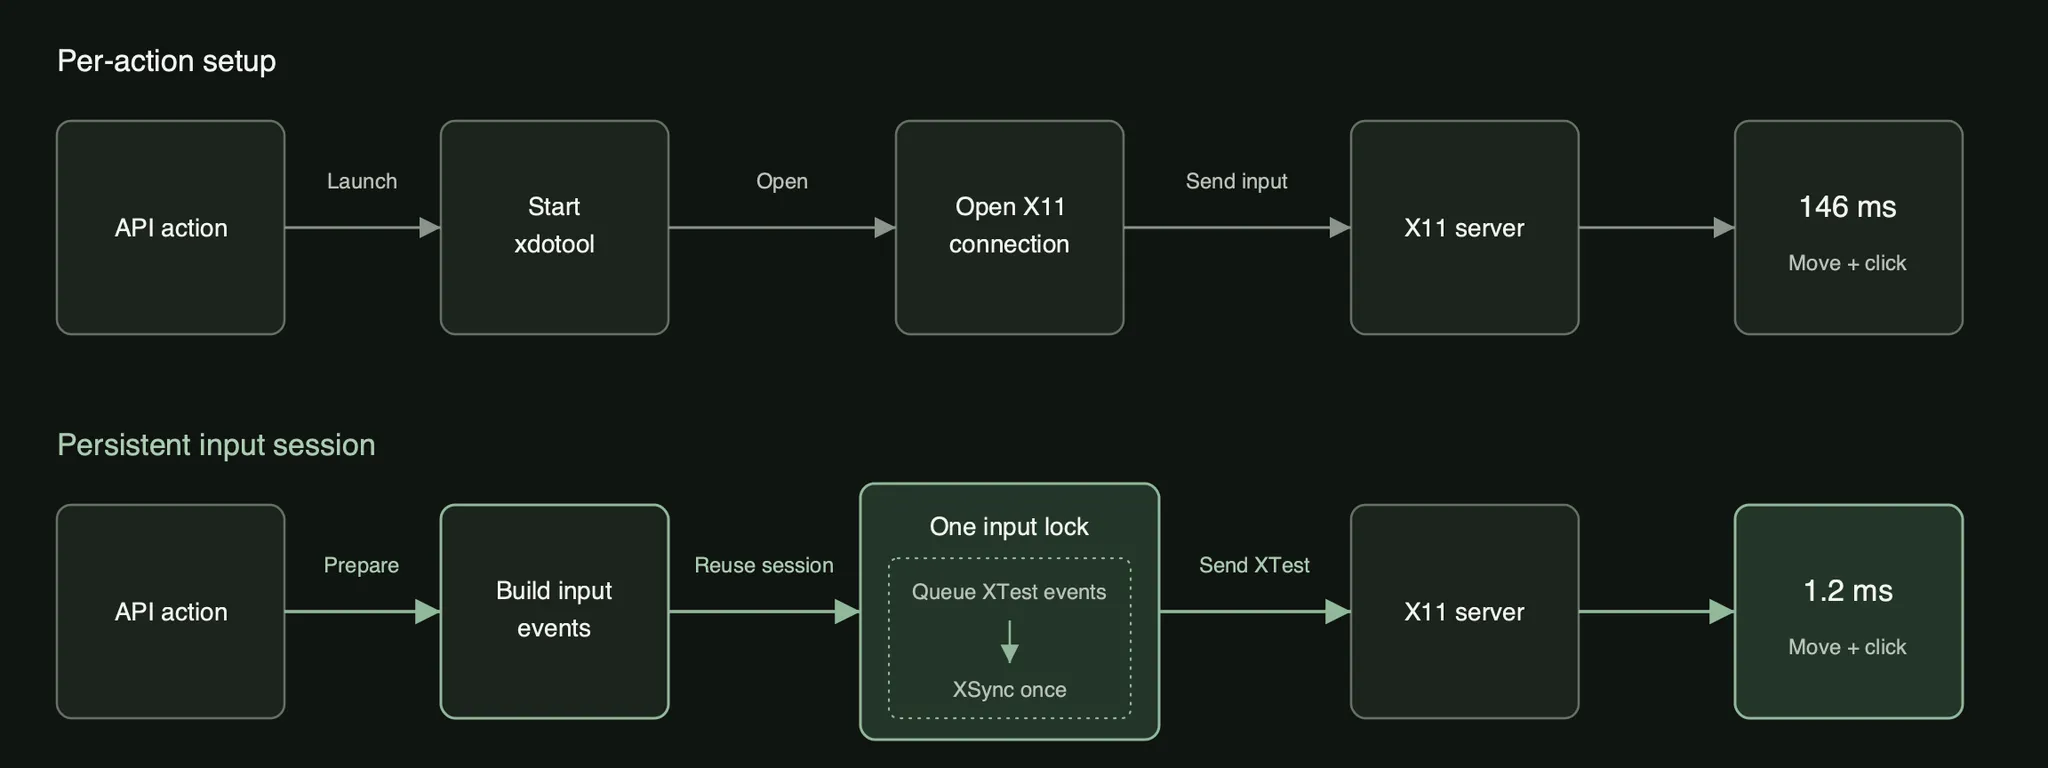
Inside the daemon, the mean for a move plus one click went from about 146 ms to 1.2 ms, a 127x speedup.
Four move-and-click pairs went from 444 ms to 4.8 ms, a near 100x speedup. Typing gained less, for a more interesting reason. Every character costs at least a key-down and a key-up, plus modifiers when the layout needs them (on a US keyboard, ! is Shift held over 1), so the events start to matter on their own. A hundred characters fell from about 120 ms to 21 ms, and a thousand from 607 ms to 201 ms. Deleting one process per action does nothing about the two thousand events a thousand characters still have to emit.
One connection for the whole daemon means every request shares X11’s keyboard and pointer state. Suppose two requests arrive together. One sends Ctrl+L to focus the browser’s address bar; the other starts typing a URL. If a w lands before the first request releases Ctrl, the browser reads Ctrl+W and closes the tab. The daemon resolves each sequence against the active XKB layout and holds the input lock from the first press through the final release. A drag gets the same protection, so nothing can move the pointer between mouse-down and mouse-up.
Failure moved inside the daemon along with the connection. If XTest is missing when the daemon probes for it, input falls back to xdotool before any event is emitted. Once a press may already have reached the X server, replaying the request could double-click or type a character twice, so the daemon releases whatever it pressed, returns the error, and does not retry.
The persistent connection brought one more hazard with it. The daemon also uses Xlib to list and control windows, and an application window can close between the call that lists it and the call that reads its attributes. Xlib’s default asynchronous error handler treats that ordinary race as fatal and exits the process, which would take the whole desktop API down with it. To hack around this, I install a nonfatal handler before opening the display and check each call’s result, so a window that vanishes fails one request.
Four clicks, four requests?
Making a local click cost about a millisecond exposed the next repeated cost: asking for it over HTTP.
Models already produce more than one action per turn. OpenAI’s computer tool returns an ordered actions[] array. Claude can return several tool_use blocks in one response and leaves the client to sequence operations that share state. Browser Use, an open-source agent framework, hands the model’s whole action list to multi_act. Splitting those sequences into one HTTP request per click throws the batching away in the last hop before the desktop.
The SDK keeps the model’s sequence intact:
computer.actions.run([
    {"type": "click", "x": 100, "y": 100},
    {"type": "click", "x": 300, "y": 100},
    {"type": "click", "x": 300, "y": 300},
    {"type": "click", "x": 100, "y": 300},
])
The daemon validates the entire batch of actions before it touches the desktop, then holds the input lock while it runs the clicks in order. If click three fails, the response reports clicks one and two, and click four never happens. The lock that protects a single drag protects the batch too, so no other request can slip a pointer move between a press and its release.
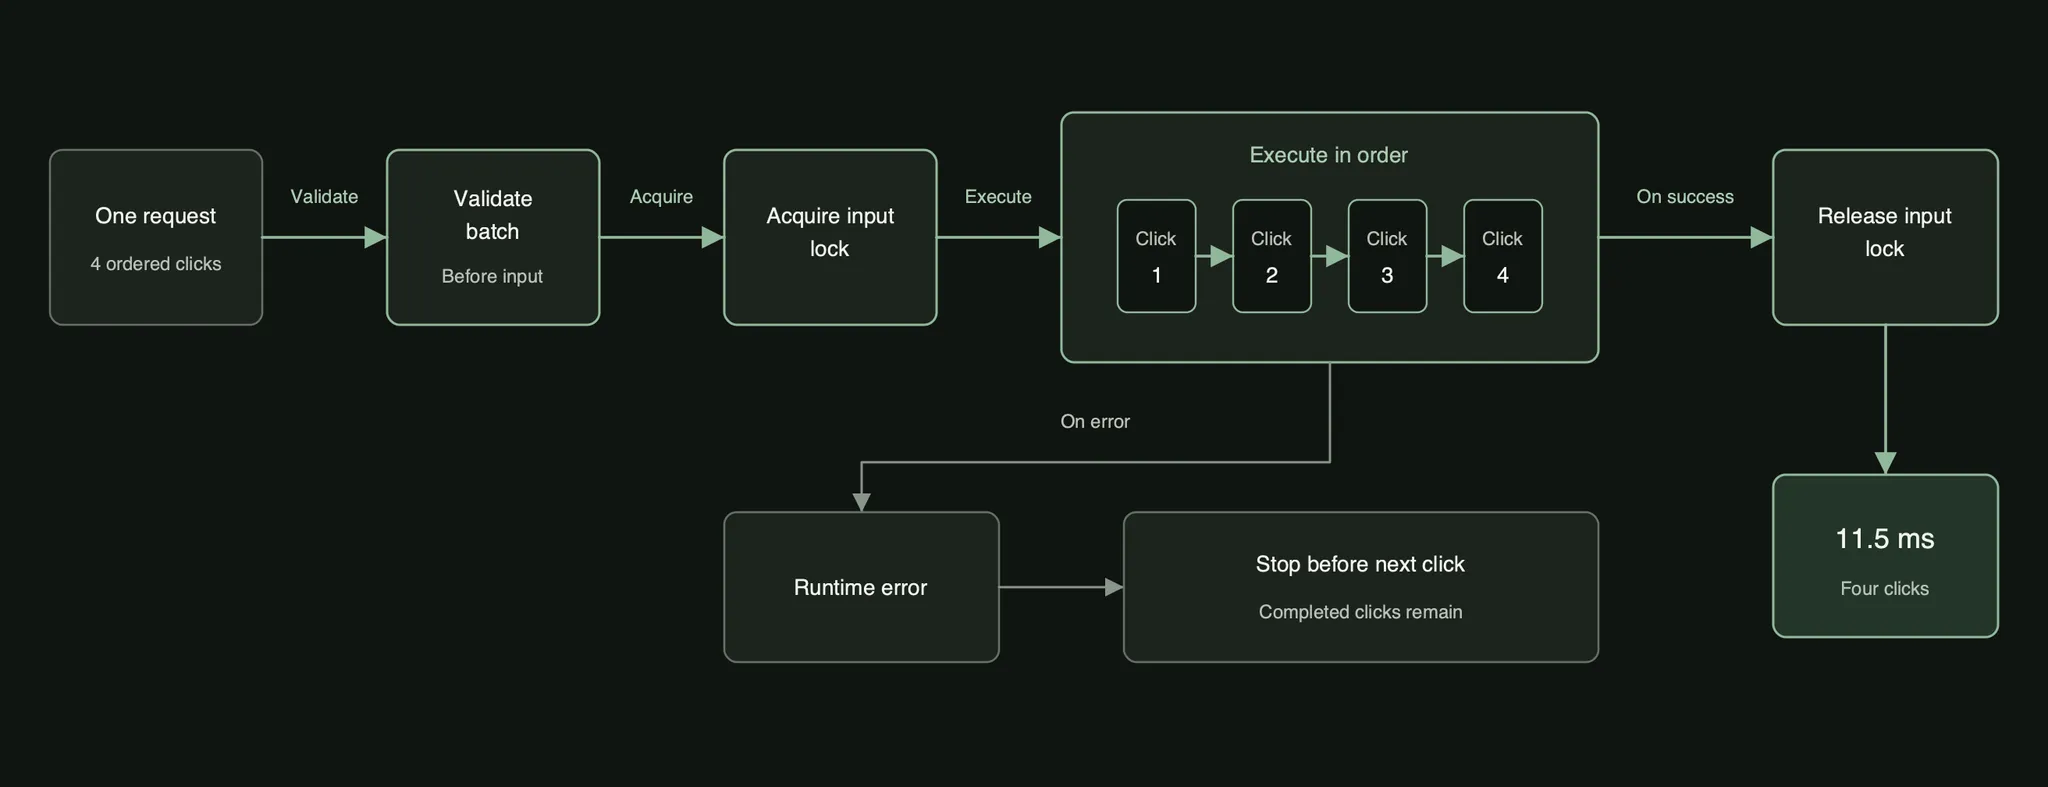
To test this, I sent a batch of four clicks. Four sequential requests took 26.8 ms. But, one ordered request took only 11.5 ms. The difference was in the three more trips through the request stack.
This is a CUA-native optimization because batched actions are a new phenomenon that barely even existed for CUA. Increasingly, batched actions are very important because RL has shown emergent usage of batched actions when available in recent recipes.
Why did command p95 jump to 220 ms?
The daemon runs shell commands in the desktop too. An agent that has just downloaded a file can confirm it with ls ~/Downloads instead of opening a file manager and reading the answer off the screen. With screenshots and clicks down in the tens of milliseconds, that endpoint started to look wrong.
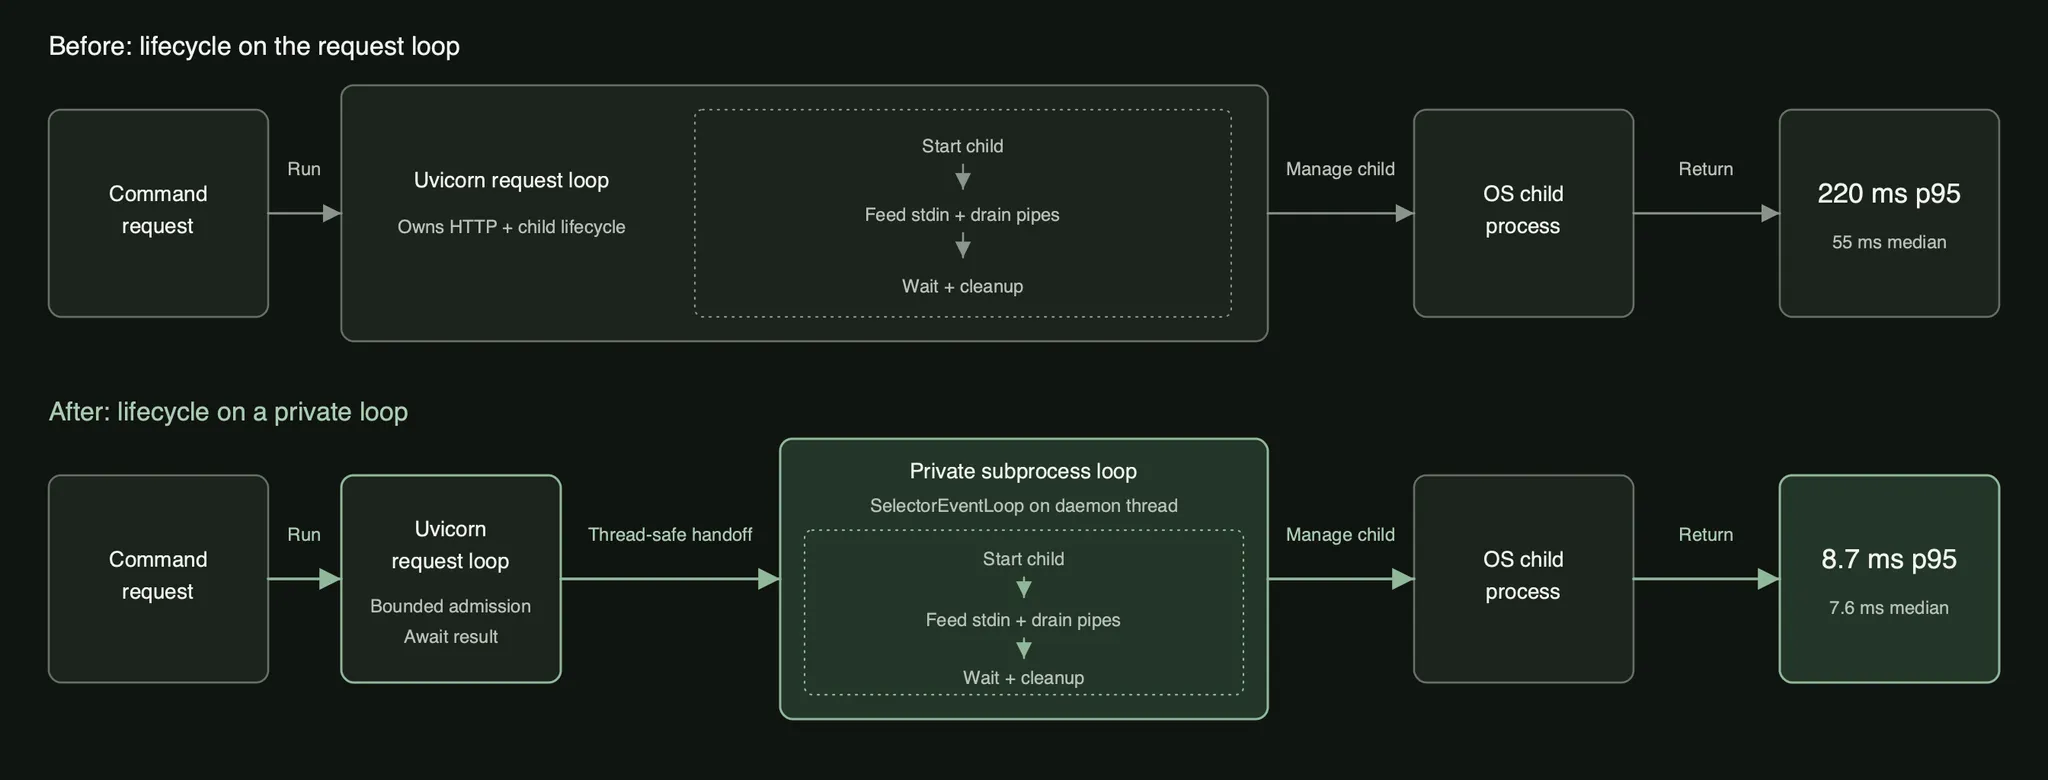
Its median was 55 ms and its p95 was 220 ms, so one request in twenty took four times as long as a typical one. Work that is simply expensive raises the median along with the tail. A median that stays low while the tail stretches out means most requests are fine and a few are stuck waiting behind something else.
The command already ran in its own OS process, so the child was not the problem. Ownership was. Uvicorn, the ASGI server running the daemon, held that child’s stdin, its output pipes, its wait state, and its cleanup, all on the same event loop that scheduled every unrelated HTTP request.
I moved the lifecycle onto a private SelectorEventLoop on a daemon thread. A capacity limit bounds how many commands can be outstanding, a thread-safe handoff starts the child on the private loop, and Uvicorn is left awaiting a single future. The private loop owns the pipes, the wait, and the cleanup. Cancelling a request kills the process group and waits for a cleanup acknowledgement before the slot is released, so a cancelled command cannot leak a child into the next one.
Over 30 samples per arm, the private loop measured 7.6 ms p50 and 8.7 ms p95. A thread pool fixes the tail too, at 10.6 ms and 13.2 ms.
The disappearing clipboard
The same ownership question turned up somewhere stranger. Agents use the clipboard constantly, because it is how you paste a shell command into a GUI terminal or drop a block of text into an editor without synthesizing hundreds of key events. Mine had a copy request that sat open long after the clipboard was ready.
Under X11 there is no central buffer holding clipboard text. A client process owns the selection, and when another application pastes, X11 goes back to that process and asks it for the bytes. That is why xclip leaves a small process alive after a write: if the process exits, the clipboard is empty. In my daemon, that necessary background process was also holding the HTTP request open.
My generic subprocess helper assumed a child’s output mattered. It created pipes for stdout and stderr, then called communicate(), which waits until every process holding the write ends has closed them. The long-lived xclip owner had inherited those handles and had no reason to close them. From the outside the failure looked absurd. The agent copies a shell command, the selection is ready, a paste from any application would work, and the copy request is still open.
xclip has nothing to say on stdout or stderr. I pointed both at DEVNULL instead of creating pipes. The request now returns as soon as xclip owns the selection, and the process stays alive for the paste that comes later.
Up to 770x faster
In our optimized Modal setup: A full screenshot returned in 37 ms. One click took 10 ms.
The biggest ratio in the table belongs to typing. The 1,000-character case took 53 ms through my optimized Modal path, which sends every character over the persistent XTest connection, against about 41 seconds through E2B’s computer-use SDK. 770x faster with our setup.
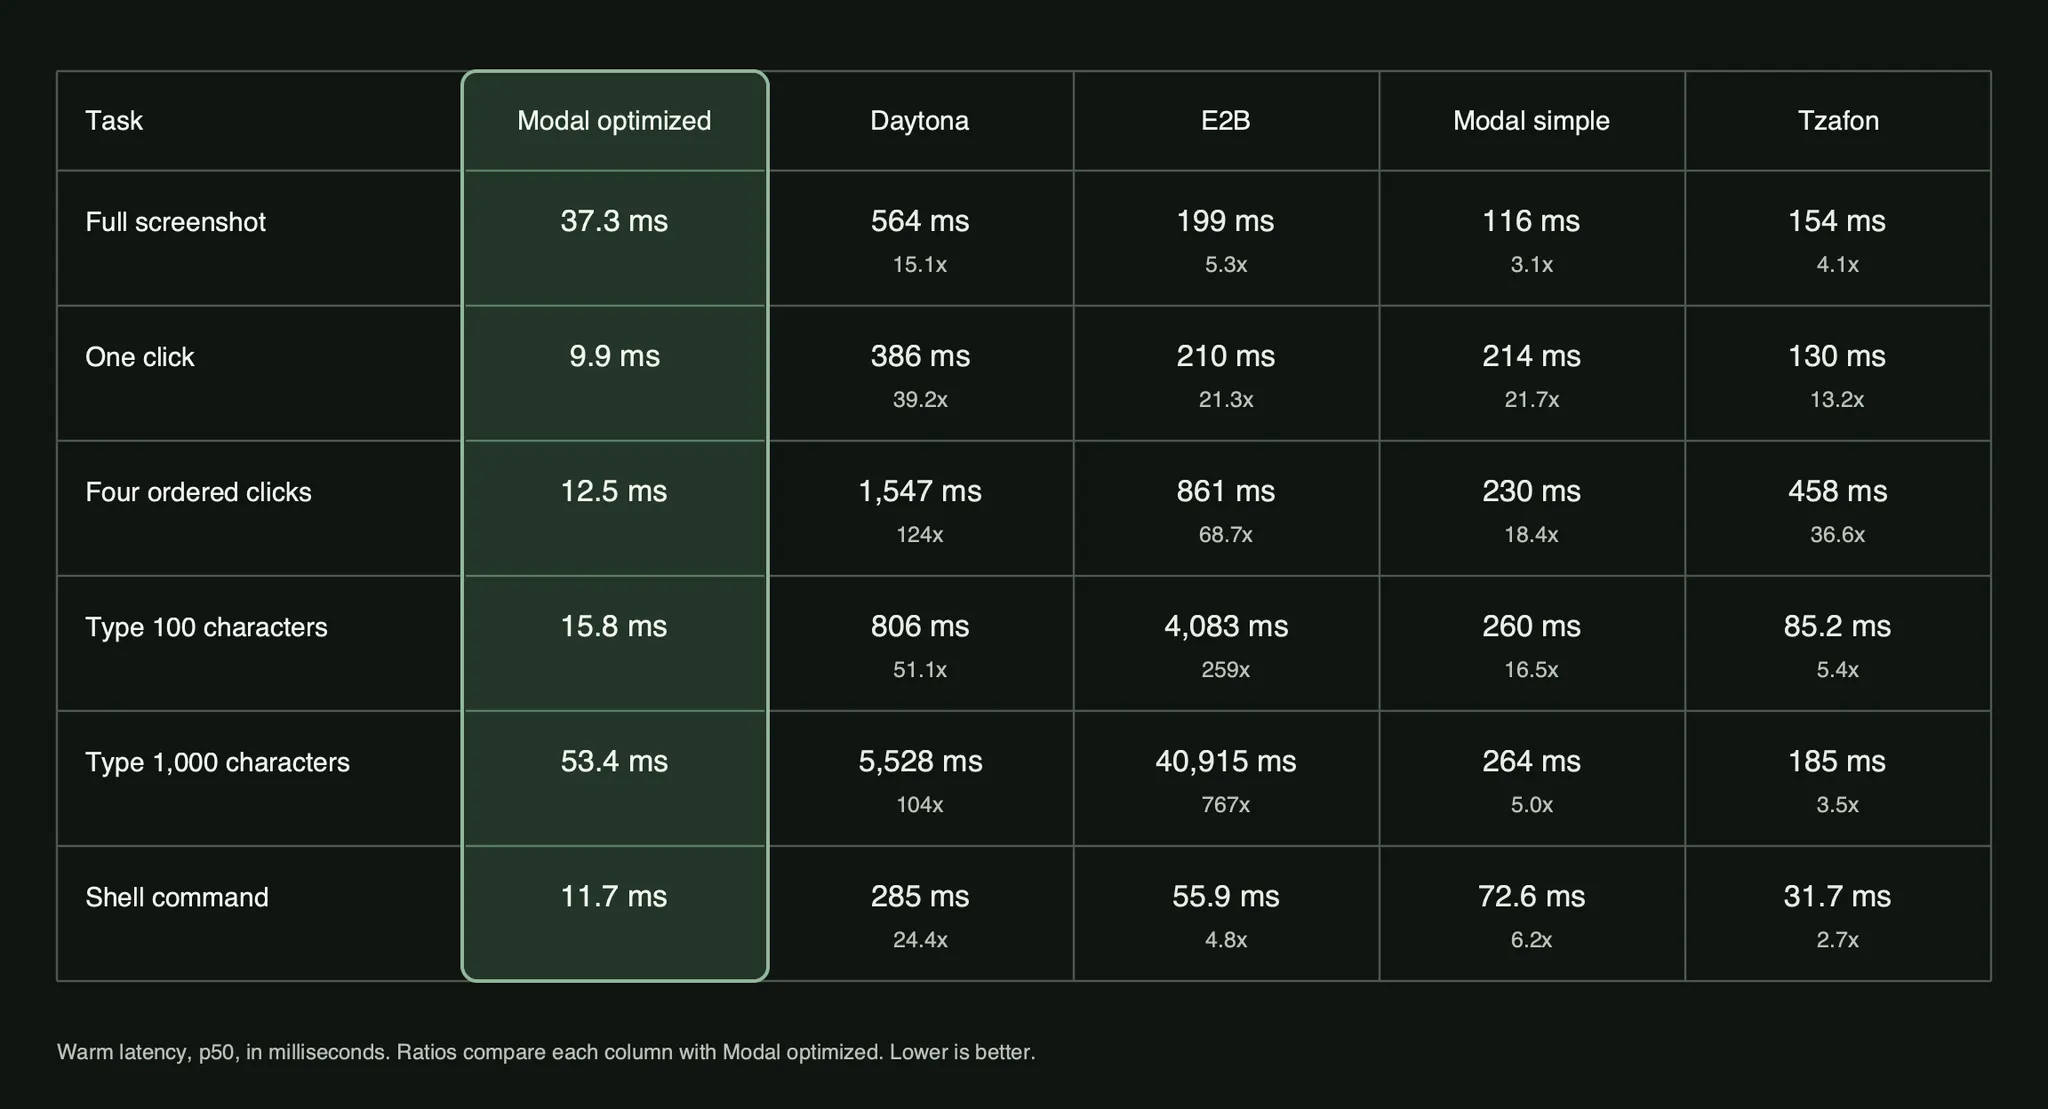
Every provider ran through its public default computer-use path, and only Modal optimized was tuned. The Modal simple column is the public ComputerSandbox configuration in this library, with identical source between the two runs’ revisions, and it already included MSS screenshot capture. The computer-use SDKs of Daytona, E2B, and Tzafon stayed on their defaults.
Each screenshot row uses that path’s native format: Tzafon returned a 1280x720 JPEG, and Modal, Daytona, and E2B returned a 1024x768 PNG.
The four-click row is where batching shows up. Modal optimized, Modal simple, and Tzafon each accepted one four-click request. Daytona needed four requests, and four E2B SDK calls, which turned into eight transport requests. Adding three clicks cost the two Modal rows about 3 ms and 16 ms, respectively. It cost E2B about 650 ms and Daytona about 1,160 ms! The request path had become more expensive than the input it carried.
What counts as the next frame?
A 10 ms click does not mean the application has drawn anything. When an agent clicks Save and immediately asks for a screenshot, the input request can succeed before the application repaints, and the frame that comes back still shows the unsaved form. The model reads that as failure and clicks Save again.
My first detector polled: wait an interval, capture a frame, compare it with the baseline, repeat. That works, and every miss costs a full capture.
XDamage is an X11 extension that reports when a region of the display has been repainted. I arm a watcher before the action and treat its notification as a cue to capture instead of a fixed schedule. Where XDamage is unavailable, the detector polls.
A repaint can redraw identical pixels, so the notification alone cannot prove the screen changed. After each wake-up the daemon captures the full-resolution RGB frame and hashes every pixel, then compares that digest with the baseline before any resizing or PNG encoding. A matching hash sends the detector back to sleep. A different hash gets encoded and returned as the next screenshot. XDamage decides when to look. The hash decides whether anything happened.
Click to first changed frame: 76 ms p50 and 88 ms p95, across 30 samples.
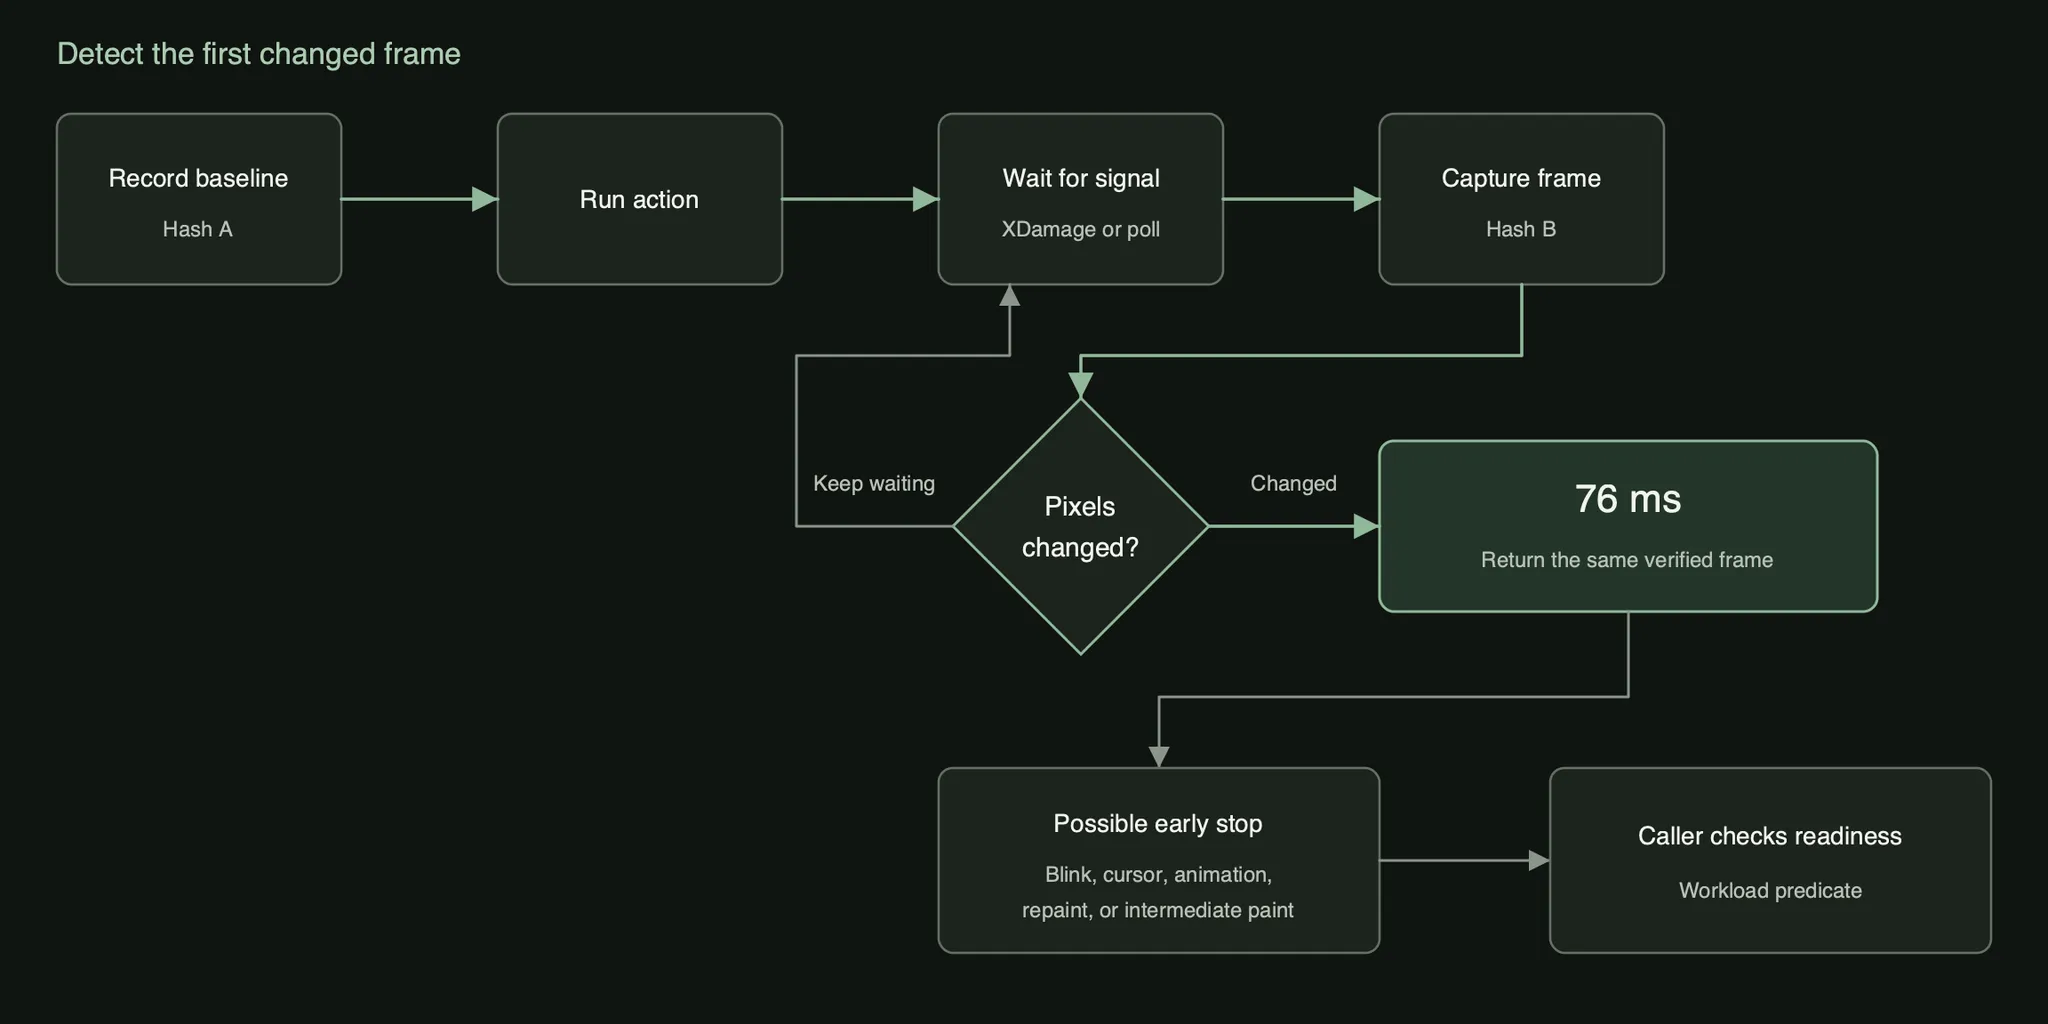
A first changed frame answers one narrow question: have new pixels appeared yet? It can replace a fixed sleep when the first visual response is all the agent needs. It cannot tell me that Save finished. A blinking cursor or an intermediate paint can satisfy the pixel check first, and a successful save can leave the watched region unchanged. Before a dependent action, the caller still needs an application-specific condition, such as the saved confirmation appearing.
This is an experimental feature that will matter even more as CUAs get faster over time. In tailored use cases, I can foresee the need for application-layer changed frame contracts as a naive optimization.
Under a cent a minute
Modal bills a Function and a Sandbox for the seconds each one is alive. The two together cost under a cent a minute. Between runs, it costs nothing. The entire benchmark run cost only about 6 cents.
Startup now takes 10 seconds
Creating a fresh Modal desktop and receiving its first validated screenshot right now takes 10.2 seconds.
Further work needs a timestamp at lifecycle boundaries. If allocation dominates, a pool of ready desktops is worth testing. If desktop or daemon startup dominates, the work belongs on the image instead. A pool or a heavier image each buy startup time at a price, so I kept this SDK light enough that the choice belongs to whoever runs it.
Computer-use SDKs for fun and profit
On Modal, a fifty-turn task that spent sixteen seconds waiting now spends under two and a half. Every one of those changes was the same change. Something that was being built once per action became something built once per session.
Not one of them was available to me on a computer-use API, because each one is a seam a product owns: where the client runs, what a single request carries, how the daemon holds the display, who owns a child process. Modal provided the seams. A Sandbox and a Function are separate things I could place in the same region, and cost efficiency came from intuitive knobs to control resources.
That is how I tuned Modal’s general-purpose AI infra platform to be faster than the companies that sell this as a product. The future is customization.
Originally published on X.